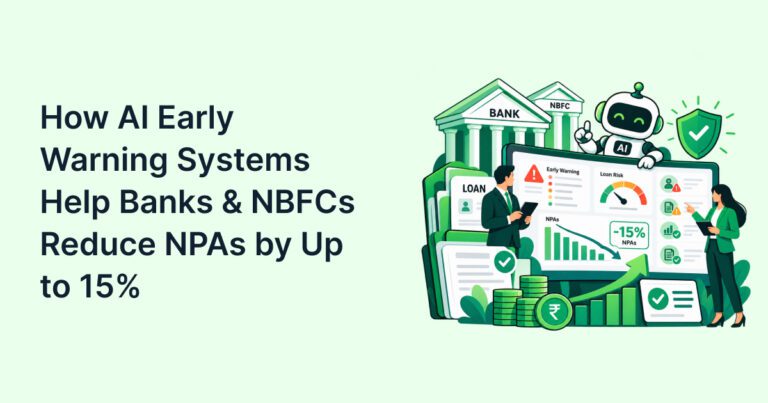
In short: Credit intelligence requires tracking predictive indicators like early warning system (EWS) triggers, 30+ DPD migration, and roll rates. Monitoring these portfolio risk metrics allows lenders to intercept defaults before they destroy capital.
Risk teams at Indian NBFCs and fintechs frequently stare at reports showing defaults that happened a month ago. Managing a lending portfolio by looking in the rearview mirror guarantees high non-performing loans (NPLs). When market conditions tighten, historical repayment data fails to protect your balance sheet.
To protect asset quality, finance leaders must shift from reactive reporting to proactive portfolio monitoring. This requires identifying the subtle behavioral shifts a borrower makes right before they miss a payment.
Managing a high-volume loan book requires systematic oversight. Finance leaders using Fintly’s Early Warning System (EWS) automatically flag borrower stress through configurable triggers. This capability transforms raw bureau and transaction data into actionable risk analytics, giving collections teams a 60-day head start on potential defaults.
What Is Credit Intelligence in Modern Lending?
To build true credit intelligence, you need to transition from historical reporting to forward-looking analysis using live data signals. It combines continuous borrower monitoring, transactional banking data, and external macroeconomic shifts into actionable alerts.
Most financial institutions sit on massive volumes of data. They track origination volumes, repayment schedules, and final write-offs. Credit intelligence is the operational layer that sits between origination and late-stage collection.
The real bottleneck: risk teams spend weeks manually reconciling Excel sheets to find stressed accounts, missing the narrow window where intervention actually works.
Credit intelligence automates this discovery phase. It applies risk analytics to your active portfolio, identifying accounts that are technically current but practically failing. By tracking the right lending analytics KPIs, you stop chasing bad debt and start preventing it.

How Do Predictive Risk Indicators Expose Hidden Portfolio Stress?
To expose hidden stress, you need predictive risk indicators that track early behavioral shifts like payment bounces and dropping cash reserves. These metrics signal an inability to pay long before an official missed payment registers on a ledger.
If you’re wondering which metrics predict default risk most accurately, here’s the short answer: first payment defaults, ACH mandate bounces, and sudden limit utilization spikes predict failure weeks faster than traditional credit scores.
Contrary View: Legacy credit managers frequently argue that traditional bureau scores and 90+ DPD ratios provide sufficient portfolio visibility. The reality is that credit scores are severely lagging indicators. By the time a CIBIL score drops, the borrower has already prioritized other financial obligations over your loan.
62% of Indian lending executives state that delayed risk visibility is the primary driver of late-stage collection costs.
Predictive indicators measure current financial capacity, not historical intent. When you monitor live metrics, you catch the borrower who just lost their primary income source, even if they have never missed an EMI before.
The 10 Credit Intelligence Metrics to Monitor Daily
To control portfolio health, you need to track these 10 specific lending analytics KPIs continuously. Reviewing these figures quarterly creates blind spots that ruin asset quality.
| Metric | Category | What It Signals |
| EWS Trigger Activation Rate | Leading | Volume of accounts hitting predefined stress parameters. |
| 30+ DPD Migration Rate | Lagging/Leading | Speed at which early delinquencies become serious defaults. |
| Roll Rates | Lagging | Percentage of accounts moving from one delinquency bucket to the next. |
| First Payment Default (FPD) | Leading | Underwriting quality and potential origination fraud. |
| Payment Bounce Rate | Leading | Immediate cash flow stress or intent issues. |
| Limit Utilization Rate | Leading | Credit hunger and over-leverage in revolving facilities. |
| Concentration Risk Index | Structural | Over-exposure to specific industries, geographies, or segments. |
| Cash Flow Stress Index | Leading | Declining business turnover or personal income. |
| Restructuring Requests | Leading | Self-identified borrower distress requiring policy action. |
| Vintage Curve Performance | Structural | Long-term asset quality grouped by origination month. |
1. EWS Trigger Activation Rate
This measures the percentage of your portfolio activating rules within your Early Warning System. A sudden spike indicates systemic stress, perhaps tied to a specific geographic region or loan product. Setting up these thresholds requires precise logic. Read How Decision Tables Simplify Risk Pricing and Eligibility Rules to see how teams configure these rules without engineering help.
2. 30+ DPD Migration Rate
Tracking how many accounts move from 1-29 days late into the 30+ category is critical. High migration means your early-stage collection strategies are failing.
3. Roll Rates (Bucket to Bucket)
Roll rates measure the exact percentage of balances moving from 30 to 60 DPD, and 60 to 90 DPD. You calculate this to forecast future NPLs accurately.
4. First Payment Default (FPD) Rate
If a borrower misses their very first EMI, it is rarely an accident. High FPD rates indicate a failure in the initial risk analytics process or outright application fraud.
5. Payment Bounce Rate (ACH/NACH)
A bounced mandate is the loudest alarm bell in credit intelligence. Immediate bounce responses should include automated notifications, dynamic shifts to a high-priority call queue, and holds on further credit line disbursements.
6. Limit Utilization Rate
For revolving credit or overdraft facilities, a borrower consistently maxing out their limit demonstrates severe credit hunger. High utilization correlates strongly with imminent default.
7. Concentration Risk Index
This measures your exposure density. If 40% of your SME book is tied to a single manufacturing sector, a supply chain disruption in that sector threatens your entire firm.
8. Cash Flow Stress Index
This requires integrating transactional banking data. By evaluating bank statements, you measure if a borrower’s monthly inflows are dropping relative to their fixed outflows.
9. Restructuring Request Volume
Track how many borrowers formally request tenure extensions or EMI reductions. A rising volume requires a strategic review of your underwriting parameters. For more on adjusting models to market reality, see our guide on Model Risk Management: AI in Lending.
10. Vintage Curve Performance
Vintage curves clearly show if loans originated in Q1 are performing fundamentally worse than loans originated in Q3, allowing you to trace problems back to specific policy changes.
Illustrative Example: Catching Defaults 60 Days Early
To catch defaults early, you need to monitor operational cash flow in real-time, specifically in SME supply-chain financing. This approach reveals cash crunches weeks before an EMI bounce occurs.
Illustrative Example: Consider an Indian NBFC financing distributors for a major FMCG brand. Traditionally, the risk team relies on 30-day delinquency reports. A distributor experiences a sudden drop in retail sales and begins delaying payments to secondary suppliers. Under a legacy system, the NBFC learns about this stress only when the distributor misses their EMI on day 45.
With a credit intelligence platform running an active EWS, the system flags predictive risk indicators simultaneously on day 15.
Early warning triggers:
- A 40% drop in average daily bank balance
- Two consecutive vendor cheque bounces
- A sudden spike in credit inquiries pulled from the bureau
The relationship manager engages the distributor, restructures the short-term repayment plan, and avoids a complete write-off. According to a recent analysis, localized economic shocks account for a significant portion of unexpected NBFC losses, making early intervention critical. (RBI: Financial Stability Report 2025)
What Is the Commercial Cost of Limited Risk Visibility?
To protect your balance sheet, you need to understand that delayed risk visibility directly burns operational capital through inflated collection costs and unavoidable write-offs.
When risk analytics are siloed, teams waste hours compiling reports instead of calling high-risk accounts. Waiting for an account to hit 60+ DPD increases the final cost of recovery by nearly three times compared to intervening at the first bounced payment.
Cost of inaction consequences:
- Higher capital provisioning requirements that freeze growth capital
- Regulatory audit exposure for lacking proactive risk frameworks
- Management decisions based on outdated default data
Fintly’s EWS rule engine prevents this by pushing actionable intelligence to the collections team exactly when they need it.
Bottom line: manual monitoring costs analyst time and furthermore, it compounds into massive write-offs because the intervention happened too late.
Conclusion
Credit intelligence separates institutions that manage crises from those that prevent them. Relying entirely on lagging indicators like traditional credit scores and historical DPD reports leaves your portfolio exposed to sudden market shifts and borrower stress. By tracking the top 10 portfolio risk metrics, from EWS triggers to payment bounce rates, your risk team gains the visibility needed to intercept bad debt early.
Stop reacting to defaults and start predicting them. Book a demo to see how Fintly’s Early Warning System automates risk analytics and secures your loan book.
 QUICK ANSWERS
Frequently Asked Questions (FAQs)
Your most common questions, answered with precision and insight
Credit intelligence is the continuous, data-driven process of monitoring a loan portfolio using predictive risk indicators. It combines borrower behavior, transaction data, and market signals to identify financial stress before a default occurs.
The most accurate predictive risk indicators are first payment default (FPD) rates, ACH mandate bounce frequencies, and early warning system (EWS) trigger activations. These leading indicators show a borrower’s immediate inability to pay.
Risk analytics should be updated continuously, ideally on a daily or weekly batch cycle. Reviewing portfolio risk metrics on a monthly or quarterly basis creates dangerous blind spots and allows early delinquencies to age into severe defaults.
Essential lending analytics KPIs for NBFCs include 30+ DPD migration rates, bucket-to-bucket roll rates, limit utilization ratios, and cash flow stress indices. These metrics provide a comprehensive view of overall asset quality.
An Early Warning System (EWS) automates portfolio monitoring by scanning account data against predefined risk rules. When an account breaches a threshold, the EWS flags it for immediate operational intervention.
Traditional credit scores still matter for origination, but they are lagging indicators for portfolio monitoring. A borrower’s score usually drops 45 to 60 days after they experience financial stress, making it too slow for proactive credit intelligence.

Author
Subject Matter Expert (Lending) Fintly.co
Vijay Mali is a results-driven professional with deep expertise in HFC/NBFC startups, compliance, and underwriting. He specializes in delivering end-to-end solutions for financial institutions, focusing on Business Rule Engines (BRE), workflow automation, and AI-driven credit decision-making. He is passionate about leveraging Machine Learning (ML) scorecards and AI-powered risk assessment to optimize lending processes and drive digital transformation in the financial sector.