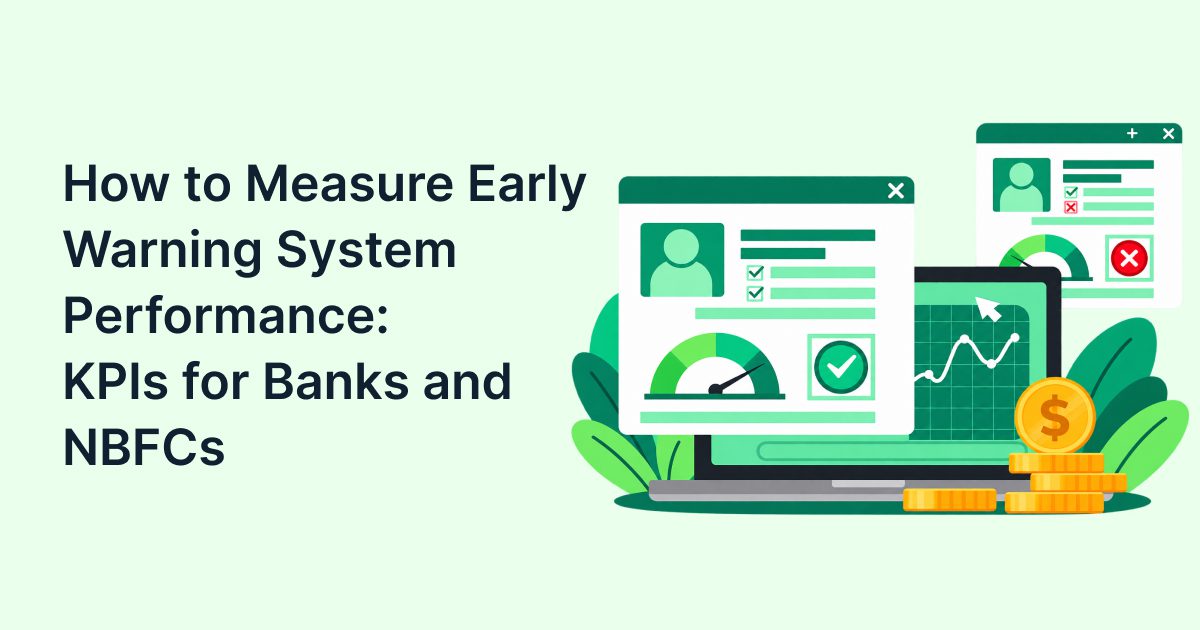
Banks and NBFCs should measure early warning system performance across five areas: data coverage, alert quality, lead time, investigation speed, and portfolio outcomes. The most useful early warning system KPIs include precision, recall, false-positive rate, alert turnaround time, intervention rate, NPA formation, cure rate and loss avoided; not just the number of alerts generated.
An EWS is performing well when it identifies genuine borrower or transaction risk early enough for the institution to act, and when those actions improve credit or fraud-risk outcomes.
Why alert volume is not EWS performance
An early warning system can generate thousands of alerts and still fail to protect a lending portfolio.
The problem is simple: alert volume measures activity, not effectiveness. A high number of alerts could mean that the system is detecting more risk. It could also indicate weak thresholds, duplicate signals, poor data quality or an investigation team struggling with alert fatigue.
A useful EWS measurement framework follows the complete risk-management chain:
Data quality → signal quality → alert → investigation → intervention → borrower outcome → portfolio impact
This guide explains how banks and NBFCs can measure every stage of that chain. It covers the most important EWS metrics, formulas, dashboard views, NPA measurement methods and governance indicators.
If your team needs to connect early warning signals with structured review and action, you can learn more about Fintly’s early warning signs platform.

What should an EWS measure beyond alerts?
A practical EWS scorecard should measure five layers –
- Coverage and data quality: Is the system monitoring the right accounts with reliable data?
- Signal and model quality: Are alerts identifying genuine risk?
- Timeliness and workflow: Are teams receiving, assigning and investigating alerts quickly?
- Intervention and portfolio outcomes: Do alerts lead to action and better credit outcomes?
- Governance and validation: Can the institution explain, test and audit the system?
A useful way to frame EWS effectiveness is –
This is a practical management framework, not a regulatory formula.
The key idea is that detection is only the first step. An alert that is accurate but arrives after a missed payment has limited value. An alert that arrives early but is never assigned to an owner is also ineffective.
Which early warning system KPIs should banks and NBFCs track?
The right KPI mix depends on the institution’s portfolio, data availability, review capacity and risk appetite. However, most banks and NBFCs should begin with the following framework.
“EWS effectiveness = detection quality + lead time + actionability + portfolio impact − operating cost”
| KPI category | Example metrics | What it tells management |
| Coverage and data | Portfolio coverage, data freshness, exception rate | Whether the EWS is monitoring the right data |
| Alert quality | Precision, recall, false-positive rate | Whether alerts identify genuine risk |
| Timeliness | Lead time, alert latency, investigation TAT | Whether teams can act early |
| Intervention | Action conversion, escalation, watchlist conversion | Whether alerts produce documented action |
| Portfolio outcomes | NPA formation, cure rate, roll-forward rate | Whether interventions improve risk outcomes |
| Governance | Validation, overrides, audit-trail completeness | Whether the system is controlled and reviewable |
How should institutions measure EWS coverage and data quality?
Before measuring model performance, confirm that the system is receiving complete and timely information.
Important data-quality KPIs include –
- Portfolio coverage: Monitored eligible exposure divided by total eligible exposure.
- Data freshness: Records received within the required time window divided by expected records.
- Data completeness: Populated and usable fields divided by total required fields.
- Data exception rate: Missing, duplicate or invalid records divided by total records.
- Integration uptime: Available monitoring time divided by scheduled monitoring time.
- Segment coverage: Products, geographies and borrower segments monitored divided by the intended coverage.
An EWS can appear accurate while excluding accounts with missing data. That is why coverage and data-quality metrics should be reported alongside precision and recall.
This becomes especially important when institutions combine data from lending management systems, core banking platforms, credit bureaus, bank statements, transaction systems and external information sources.
How should teams measure alert and model quality?
Precision is the share of alerts that match a defined adverse event. It answers: “When the system raises an alert, how often is it useful?”
Precision = True positive alerts/Total alerts (/ = divided by)
Recall, also called sensitivity, is the share of adverse events that the EWS detects. It answers: “Of all accounts that deteriorated, how many did the system identify?”
Recall = True positive alerts/Total adverse events (/ = divided by)
Other useful model-quality metrics include –
- False-positive rate: The share of non-adverse accounts incorrectly flagged.
- False-negative rate: The share of adverse accounts missed by the system.
- F1 score: A combined measure of precision and recall.
- Top-risk capture rate: The share of adverse accounts found in the highest-risk segment.
- Calibration: Whether predicted risk levels broadly match observed outcomes.
- Population stability: Whether account or score distributions have changed materially over time.
- Override rate: How often human reviewers change system-generated classifications.
Accuracy alone is not enough. If only a small percentage of accounts default or become fraudulent, a system can show high accuracy while missing a large share of genuinely risky accounts.
How should banks measure EWS lead time and response speed?
An EWS creates value only when it provides enough time for a useful response.
Track –
- Alert latency.
- Lead time to default, downgrade, fraud classification or serious delinquency.
- The share of adverse events detected 30, 60 or 90 days early.
- Alert acknowledgement time.
- Investigation turnaround time.
- SLA breach rate.
- Escalation rate.
- Closure time.
- Reopen rate.
The first alert date should be compared with the date of the defined adverse event. That event might be a missed payment, a delinquency bucket movement, a rating downgrade, a fraud classification or a formal watchlist decision.
RBI’s 2026 fraud-risk-management directions for applicable NBFCs state that the risk-management committee should prescribe a suitable turnaround time, preferably not exceeding 30 days, for examining EWS alerts or triggers.
That regulatory expectation should not be treated as a universal operating target. High-severity alerts, large exposures and suspected fraud often require shorter internal timelines.
Which credit risk KPIs show whether the EWS improved outcomes?
Senior management should connect EWS activity with portfolio results. Useful credit risk KPIs include –
- NPA formation rate.
- Roll-forward rate, which measures movement into a worse delinquency bucket.
- Roll-back rate, which measures improvement after intervention.
- Cure rate, which measures accounts returning to performing status.
- Exposure at risk.
- Recovery uplift.
- Avoided loss.
- Loss-given-default reduction.
- Restructuring success rate.
- Cost per resolved alert.
These metrics should be segmented by product, borrower type, geography, vintage and risk tier. A single portfolio-level number can hide weak performance in a specific segment.
How do you calculate the most important EWS metrics?
A KPI becomes useful only when the institution defines the event, data window, owner and action associated with it.
| Metric | Formula | Management question |
| Precision | True positive alerts ÷ total alerts | How many alerts were genuinely useful? |
| Recall | True positive alerts ÷ total adverse events | How much adverse risk did we detect? |
| False-positive rate | False positive alerts ÷ total non-adverse accounts | How much review effort is wasted? |
| Investigation rate | Investigated alerts ÷ total alerts | Are alerts being reviewed? |
| Action conversion rate | Alerts resulting in intervention ÷ total alerts | Do alerts lead to action? |
| Lead time | Adverse event date − first alert date | How early did the system identify risk? |
| Cure rate | Cured accounts ÷ eligible deteriorated accounts | Did borrowers improve after intervention? |
| NPA formation rate | New NPAs ÷ monitored performing portfolio | Is deterioration increasing or decreasing? |
| SLA breach rate | Alerts exceeding TAT ÷ total alerts | Are teams meeting response expectations? |
| Portfolio coverage | Monitored eligible exposure ÷ total eligible exposure | Is the EWS covering the intended book? |
For every KPI, define –
- The adverse event.
- The observation period.
- The data source.
- The reporting owner.
- The target or threshold.
- The action required when performance declines.
For example, “NPA reduction” should not mean only that the NPA ratio fell after an EWS was introduced. The result could also reflect write-offs, portfolio sales, restructurings, changes in underwriting or a favourable economic environment.
How should banks and NBFCs measure NPA reduction?
NPA reduction is a lagging outcome. By the time an account becomes an NPA, the earliest opportunity to intervene may already have passed.
A stronger measurement approach is –
- Record the date of the first EWS signal.
- Define the adverse event and observation window.
- Record the investigation and intervention.
- Compare the account with similar accounts that did not receive the intervention.
- Track delinquency movement, cure, restructuring and recovery.
- Separate genuine improvement from write-offs, exits and reclassification.
The Reserve Bank of India reported that the gross NPA ratio of scheduled commercial banks’ MSME portfolio fell from 4.5% in March 2024 to 3.6% in March 2025. That is useful asset-quality context, but it does not prove that any single EWS caused the improvement.
Institutions should therefore report four separate outcomes –
- Detection success: The system identified risk.
- Workflow success: The alert was assigned and investigated.
- Intervention success: The team took an appropriate action.
- Outcome success: The account or exposure improved.
This distinction prevents teams from claiming NPA reduction when the EWS only improved alert generation.
What should an EWS dashboard show?
An EWS dashboard should serve different users. A CRO does not need the same view as an investigation analyst or model-risk manager.
What should the executive dashboard show?
- Exposure at risk.
- High-severity open alerts.
- Lead-time trend.
- NPA formation and cure rates.
- Roll-forward and roll-back rates.
- Open SLA breaches.
- Risk concentration by segment.
- Estimated loss avoided, where the method is documented.
What should the risk-team dashboard show?
- Precision and recall.
- False-positive and false-negative trends.
- Missed-event analysis.
- Threshold performance.
- Segment-level model performance.
- Repeat-alert ratio.
- Data exceptions.
- Model drift.
What should the operations dashboard show?
- Alerts by owner.
- Investigation backlog.
- Alert acknowledgement time.
- Investigation TAT.
- Escalations.
- Action conversion.
- Closure and reopen rates.
- Alerts by severity and ageing.
What should the model-risk dashboard show?
- Validation status.
- Calibration.
- Population stability.
- Override rate.
- Reason-code completeness.
- Data drift.
- Open validation issues.
- Remediation status.
A dashboard should show the current value, target, previous-period trend, owner and required action. A number without an owner is a report, not a control mechanism.
How do RBI expectations affect EWS measurement?
RBI treats EWS as part of a broader risk-management and fraud-risk framework rather than as a standalone prediction tool.
The 2024 RBI directions require banks to maintain an EWS and Red Flagged Account framework under their fraud-risk-management policy. They also cover suitable indicators, integration with relevant systems, validation and governance.
The 2026 directions for applicable NBFC Upper- and Middle-Layer entities require an EWS framework under the board-approved fraud-risk-management policy. They also require appropriate indicators for monitoring credit facilities, loan accounts and other financial transactions, with periodic review of indicator effectiveness.
For measurement purposes, this means institutions should maintain evidence of –
- Board and committee oversight.
- Quantitative and qualitative indicators.
- Defined thresholds and risk tiers.
- Alert ownership and response timelines.
- Periodic validation.
- Review of indicator effectiveness.
- Investigation and remediation records.
- An audit trail from signal to decision.
Credit-stress monitoring and fraud-risk EWS should not be treated as identical. They can share data, but their target events, escalation paths and success measures may differ.
Which EWS signals should feed the KPI framework?
The KPI framework is only as useful as the signals it measures.
What financial signals should team monitor?
- Declining revenue or cash generation.
- Rising leverage.
- Weakening interest coverage.
- Delayed receivables.
- Increasing working-capital pressure.
- Unusual balance-sheet movements.
- Deteriorating financial ratios.
What repayment and behavioural signals matter?
- Missed or delayed instalments.
- Repeated cheque returns.
- Sudden changes in limit utilisation.
- Unusual repayment patterns.
- Frequent requests for extensions.
- Sudden reduction in expected account activity.
- Repeated restructuring requests.
What transaction and qualitative signals matter?
- Unusual related-party transfers.
- Funds moving outside expected business patterns.
- Sudden changes in counterparties.
- Negative legal or regulatory information.
- Transactions that do not appear connected to the borrower’s stated business.
For a closer look at transaction-based indicators, see these early indicators of irregularities in financial statements. Teams should also understand the examples of non-business transactions and their business risks before assigning thresholds to these signals.
The objective is not to flag every unusual transaction. It is to identify patterns that are unusual, material and relevant to the borrower’s risk profile.
What does EWS performance look like in practice?
Illustrative example: An NBFC reduces alert noise without reducing risk coverage
Consider a hypothetical NBFC with a high-volume retail and MSME portfolio. Its EWS produces 1,000 alerts in a quarter.
At the end of the quarter –
- 700 alerts were investigated.
- 420 alerts resulted in documented intervention.
- 120 alerted accounts later entered the defined adverse state.
- 150 adverse accounts occurred across the monitored portfolio.
- 90 adverse accounts had been identified by the EWS earlier.
The KPI results are –
- Investigation rate: 700 ÷ 1,000 = 70%.
- Action conversion rate: 420 ÷ 1,000 = 42%.
- Precision: 120 ÷ 1,000 = 12%.
- Recall: 90 ÷ 150 = 60%.
These numbers need context. A 12% precision rate may be acceptable for a high-risk fraud screen if the cost of missing an event is high. It may be inefficient for a low-value retail queue that depends on manual investigation.
Management should ask –
- How much lead time did the alerts provide?
- Were high-value exposures concentrated in the detected group?
- Why were 300 alerts not investigated?
- Did interventions improve cure or roll-back rates?
- Were the 60 missed adverse accounts linked to data gaps?
- Did the same borrower receive multiple duplicate alerts?
This is why EWS performance cannot be judged by one KPI.
What are the common mistakes in measuring EWS performance?
The most common mistakes are –
- Treating alert volume as proof of success.
- Measuring accuracy without precision and recall.
- Ignoring false negatives.
- Failing to measure lead time.
- Using one threshold across every product and segment.
- Measuring NPA reduction without a comparison group.
- Tracking alert closure without measuring intervention quality.
- Excluding data quality from the scorecard.
- Ignoring investigator workload and alert fatigue.
- Using model scores without reason codes or audit trails.
- Treating credit-stress and fraud EWS as the same process.
The cost of inaction is practical. Risk teams spend time on low-value alerts, genuine deterioration receives delayed attention, and management cannot prove whether the EWS improved outcomes.
The institution may also struggle during governance or regulatory reviews because it cannot explain why an alert was raised, who reviewed it, what action followed or whether the action changed the outcome.
Can manual EWS monitoring still work?
Manual monitoring can still make sense for a small, concentrated portfolio or a limited set of high-value relationships. Human judgement is also important when signals are qualitative, borrower context is complex or data is incomplete.
However, manual review becomes difficult to control as portfolio size and data volume grow. Different analysts may apply different thresholds, decisions may not be recorded consistently and missed-event rates may remain unknown.
Automation should support judgement, not remove it. The right operating model combines automated signal detection with human investigation, contextual review and documented decision-making.
The same KPIs should apply to a manual process –
- Coverage.
- Review timeliness.
- Missed-event rate.
- Action conversion.
- Cure and roll-back outcomes.
- Cost per resolved case.
How can Fintly support EWS performance?
A useful EWS should help the institution move from disconnected signals to prioritised risk action.
Fintly can be evaluated in that context: not simply as a tool that generates alerts, but as part of a broader process for identifying early warning signs, organising review and supporting consistent risk operations.
The relevant questions for a bank or NBFC are –
- Can the system bring important risk signals into one monitoring process?
- Can teams prioritise alerts by severity and exposure?
- Can reviewers understand why an account was flagged?
- Can the institution track action from detection to closure?
- Can managers’ report performance use measurable KPIs?
- Can the process reduce dependence on disconnected spreadsheets and manual follow-ups?
The right answer depends on the institution’s products, data sources, risk policies and operating model. A product evaluation should therefore begin with the current EWS scorecard and its gaps.

Conclusion
The most important early warning system KPIs are not limited to alert count or model accuracy. Banks and NBFCs should measure coverage, data quality, precision, recall, lead time, investigation TAT, action conversion, cure rate and portfolio outcomes together.
The strongest EWS measurement framework connects the first signal to the outcome: what was detected, how early it was detected, what action followed and whether the exposure improved. If your institution is reviewing its EWS process, contact Fintly to discuss the right monitoring and automation approach for your portfolio.
 QUICK ANSWERS
Frequently Asked Questions
Your most common questions, answered with precision and insight
The key KPIs include precision, recall, lead time, investigation TAT, action conversion, NPA formation, cure rate and exposure at risk. Banks should also track portfolio coverage and data quality.
Precision is calculated as true-positive alerts divided by total alerts. Recall is true-positive alerts divided by total adverse events. Precision measures alert usefulness, while recall measures how much actual risk the EWS detected.
A good lead time gives the institution enough time to investigate and act before an adverse event. The right benchmark depends on the product and risk type. Track median lead time and the share of events detected 30, 60 or 90 days early.
EWS metrics show whether risk was detected early, investigated and followed by effective action. To measure NPA reduction accurately, compare similar accounts with and without intervention while accounting for write-offs, restructurings and portfolio changes.
An NBFC should track coverage, data exceptions, precision, recall, false-positive rate, lead time, investigation TAT, SLA breaches, action conversion, roll-forward rate, cure rate and exposure at risk. High-volume NBFCs should also track backlog, repeat alerts and cost per resolved alert.
Track precision, false-positive rate, duplicate alerts, repeat alerts and alerts per investigator. Low precision combined with a growing investigation backlog or rising SLA breaches usually indicates a problem with thresholds, data quality or alert prioritisation.
Include alerts by severity, exposure at risk, lead time, investigation TAT, SLA breaches, action conversion, cure rate, roll-forward rate and NPA formation. Risk teams should also monitor precision, recall, false negatives, data exceptions, overrides and model drift.
Fintly can help institutions organise monitoring around borrower, transaction and financial-risk indicators. Banks and NBFCs should assess signal coverage, alert quality, response time, action tracking and portfolio outcomes when evaluating an EWS solution.

Author
Subject Matter Expert (Lending) Fintly.co
Vijay Mali is a results-driven professional with deep expertise in HFC/NBFC startups, compliance, and underwriting. He specializes in delivering end-to-end solutions for financial institutions, focusing on Business Rule Engines (BRE), workflow automation, and AI-driven credit decision-making. He is passionate about leveraging Machine Learning (ML) scorecards and AI-powered risk assessment to optimize lending processes and drive digital transformation in the financial sector.