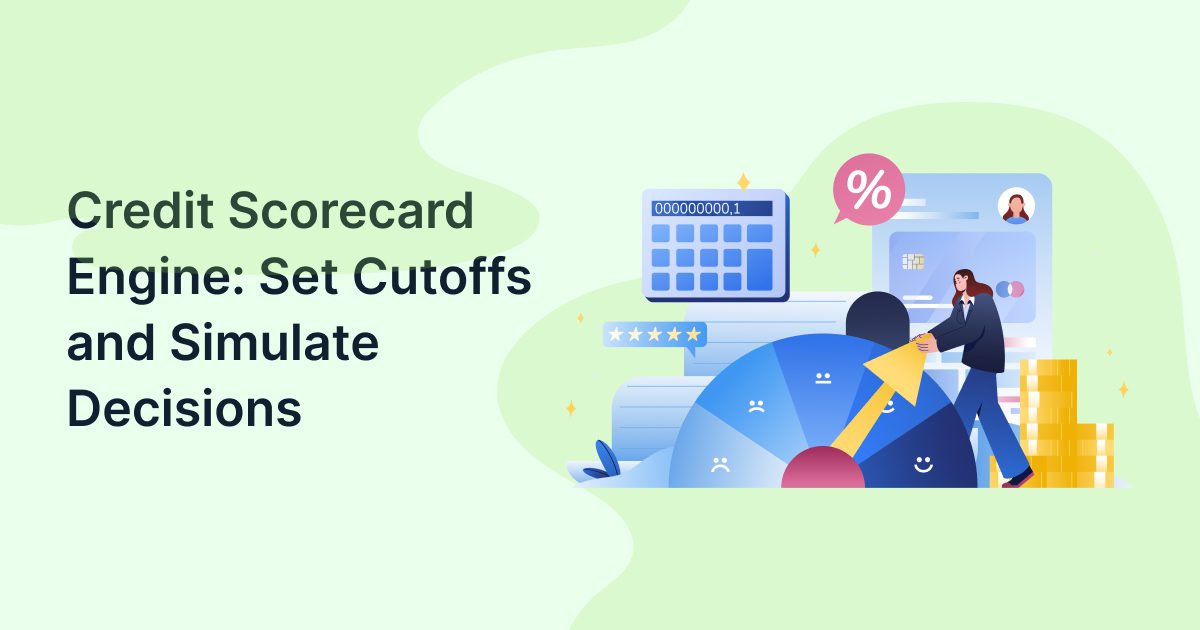
A credit scorecard engine helps lenders set approval cutoffs by replaying scored applications against alternative thresholds. Use an interactive slider to compare approval, rejection and review distributions, then evaluate the newly affected borrowers against expected losses, contribution and risk limits. Validate the preferred setting before releasing a documented policy change.
A cutoff change often starts with a familiar request: approve more applications without weakening portfolio quality. The difficult question is not where to move the line. It is which borrowers cross it, and whether their expected contribution justifies their risk.
Fintly’s ML Scoring platform supports borrower-risk prediction and explainable scoring. Its published implementation guide also describes cutoff-slider simulations and profit forecasting. This guide explains how to evaluate those simulations without confusing a better-looking approval chart with a better lending policy.
What does a credit scorecard engine cutoff control?
A cutoff is the boundary that maps a model’s output into an action. It does not replace eligibility, affordability, fraud or exposure checks. Scoring estimates risk; policy determines what the lender does with that estimate.
Confirm score direction first. A higher points-based score commonly represents lower risk. A probability of default, or PD, represents the estimated likelihood of default over a specified period: a higher value means greater risk.
For an illustrative PD policy, approve eligible applications at or below 4%, refer those above 4% through 6%, and decline those above 6%. Moving the approval boundary upward loosens this policy. Raising a minimum points-score requirement does the opposite.
If your team is still establishing the model foundation, first review the steps from historical data to a deployable scoring model. Cutoff tuning cannot repair unreliable model inputs.

How does moving the slider change decision distributions?
The slider changes which scored applications fall inside each decision band; it does not retrain the model. Hold the application sample, model, policy rules and pricing constant so the comparison isolates the threshold change.
Fintly’s published guide describes a 0–1 cutoff slider that visualizes approval and rejection rates. Before interpreting it, establish whether that output represents default probability, repayment probability or another score.
Use a histogram, application counts grouped into score intervals, and mark the current and proposed boundaries. Then inspect:
- Decision migration: identify exactly which applications change outcome, rather than comparing totals alone.
- Denominators: report approvals among eligible scored applications separately from approvals among all submitted applications.
- Boundary behavior: test values immediately below, exactly at and immediately above the cutoff using unrounded outputs.
Keep manual referrals visible. A policy that increases referrals beyond reviewer capacity creates a queue, not additional lending capacity. Treat missing scores as an explicit exception state rather than silently adding them to approvals or rejections.
How should a credit scorecard engine choose a cutoff?
Choose the cutoff that delivers acceptable risk-adjusted value within approved constraints, not the highest approval rate or classification accuracy. scikit-learn’s cost-sensitive learning example demonstrates threshold selection against business costs rather than accepting a default classification boundary.
Use the LINE checklist before approving a change:
- Lock the comparison – Freeze the population, model version, score meaning, outcome horizon and non-score rules. Otherwise, different scenarios answer different questions.
- Inspect the marginal band – Evaluate only the borrowers whose decisions change, alongside portfolio totals. Strong existing borrowers can conceal weak incremental economics.
- Net the economics – Subtract funding, servicing, acquisition, collection and capital costs, plus expected credit losses, over a consistent horizon.
- Evidence the release – Save validation results, approval authority, effective date and rollback conditions before deployment.
For calibrated PD estimates, expected loss is commonly expressed as PD × loss given default × exposure at default. Loss given default is the share of exposure lost after recoveries; exposure at default is the amount outstanding when default occurs. Keep these estimates aligned to the same horizon and loan structure.
Illustrative example: test the newly approved band
Suppose an NBFC scores 10,000 eligible applications. All applicants below pass other policy checks; every approved loan is assumed to disburse. Hold loan size, pricing and costs fixed.
| Scenario | Maximum approved PD | Approvals | Rejections | Approval rate | Average PD of approved pool |
| Conservative | 3% | 4,000 | 6,000 | 40% | 1.5% |
| Current | 4% | 5,000 | 5,000 | 50% | 1.9% |
| Proposed | 5% | 6,000 | 4,000 | 60% | 2.3% |
The proposed cutoff adds 1,000 borrowers. Their implied average PD is 4.3%, derived from the difference between the two approved pools, not the proposed pool’s 2.3%.
Assume ₹50,000 exposure per added loan, 60% loss given default and ₹1,800 contribution before credit losses over the same horizon. Expected loss per added loan is ₹1,290. Expected incremental contribution is therefore ₹510 per loan, or ₹5.1 lakh across the added band.
Now stress that band’s PD to 6%. Expected loss becomes ₹1,800 per loan, eliminating its expected contribution. These assumptions exclude further model error and changes in take-up. The simulation supports investigation, not automatic deployment.
For the broader strategy behind approval growth, see how cutoff choices connect approval volume with portfolio economics.

When should you leave the cutoff unchanged?
Leave it unchanged when the evidence cannot distinguish genuine improvement from uncertainty. Historical replay can reveal changed decisions, but it cannot reveal repayment outcomes for applicants you previously rejected.
Reject inference estimates missing outcomes for declined applicants; its assumptions do not turn those estimates into observed repayment evidence. MathWorks documents several approaches, including hard-cutoff and fuzzy augmentation methods.
Use out-of-time validation, testing on a later period excluded from development, and examine calibration, meaning whether predicted default probabilities match observed outcomes. Start with a shadow challenger that records alternative decisions without changing customer outcomes.
The contrary view
A stable, monitored threshold can be better than frequent retuning on small samples. Change should follow evidence, not dashboard activity.
Inaction still has a cost. In the hypothetical example, delaying a genuinely validated expansion would forgo the band’s expected contribution. Expanding without validation could erase it.
What belongs in the threshold-change record?
Store enough information to explain both the approved policy change and each application’s resulting decision. A chart export alone cannot reconstruct the production state.
The release record should include old and new thresholds, comparison operators, model and policy versions, simulation dataset, assumptions, validation evidence, author, approver, rationale, effective timestamp and rollback trigger. Individual decision records should preserve inputs, scores, triggered rules, outcomes and overrides.
US teams should also recognize that OCC Bulletin 2026-13, issued April 17, 2026, replaces earlier model-risk guidance and emphasizes proportionate validation, monitoring and governance. It is US supervisory guidance, not an Indian requirement or a prescriptive enforceable standard.
Key takeaways
- Treat the cutoff as a policy boundary, not a complete credit decision. Eligibility, affordability, fraud and exposure checks still determine whether an application can proceed.
- Keep simulations comparable. Hold the applicant sample, model version, pricing and other rules constant so changes in approval, rejection and referral distributions reflect the cutoff adjustment.
- Evaluate the marginal band. Focus on borrowers whose decisions change; portfolio averages can hide whether additional approvals justify their expected losses and costs.
- Separate simulated decisions from proven outcomes. Historical replay shows who would receive a different decision, not how previously rejected borrowers would repay.
- Make every threshold change defensible. Record the rationale, assumptions, validation evidence, policy version, approver and rollback conditions before deployment.
Conclusion: make the boundary defensible
A credit scorecard engine should help your team explain why a boundary deserves to move, not merely make moving it easier. Keep the comparison controlled, assess incremental economics and distinguish predicted performance from observed evidence.
Fintly’s published scoring material provides a starting point for exploring cutoff simulation. The next step is to test your own decision contract: score meaning, policy precedence, economic assumptions and release evidence. Contact Fintly to discuss your cutoff simulation requirements with a representative application sample and a defined current policy. That makes the discussion specific enough to evaluate.
Ready to evaluate your credit scorecard strategy? Book a Demo with Fintly to explore cutoff simulation using your representative application sample and current credit policy.
 QUICK ANSWERS
Frequently Asked Questions
Your most common questions, answered with precision and insight
A scorecard cutoff threshold is the boundary used to map a risk score into a lending action. It can be a minimum points score or a maximum default probability, depending on the model. Document the score’s direction, outcome horizon and equality rule. The same numerical threshold has no transferable meaning across unrelated models.
Look for an excluded borrower band with credible evidence of positive risk-adjusted contribution within your approved risk appetite. A low approval rate alone does not prove excessive strictness. Check data quality, calibration, applicant mix and other policy failures first. A cutoff adjustment will not solve declines caused by affordability or eligibility rules.
No: 0.5 is a common binary-classifier default, not a lending policy recommendation. First establish which outcome the probability represents. Then select thresholds using business costs, calibration and risk constraints.
Threshold-change history could not be verified from the product evidence reviewed for this article. Fintly describes a cutoff slider and profit simulation, but that does not establish versioned history. Ask the team to demonstrate dated changes, named approvers, historical policy retrieval and exportable records before treating those controls as available.
A vendor should demonstrate your sample applications under a current and proposed policy, including unchanged decisions and boundary cases. Ask how its credit scorecard engine handles missing values, policy overrides and model versions. Then request the simulation evidence and a historical decision reconstruction. Evaluate demonstrated behavior rather than treating feature labels as proof.
Prepare an appropriately protected representative dataset, your current cutoff rules, score definitions and target outcome horizon. Add your contribution assumptions, loss estimates and approval constraints. Fintly describes borrower-risk prediction and explainable scoring; use the discussion to establish exactly how its workflow would support your simulation, integration and governance requirements. Do not assume every requirement is included.

Author
Co-Founder, Fintly.co
Vijay Mali is a results-driven professional with deep expertise in HFC/NBFC startups, compliance, and underwriting. He specializes in delivering end-to-end solutions for financial institutions, focusing on Business Rule Engines (BRE), workflow automation, and AI-driven credit decision-making. He is passionate about leveraging Machine Learning (ML) scorecards and AI-powered risk assessment to optimize lending processes and drive digital transformation in the financial sector.